When we consider purchasing a house to be used as a long term rental unit, we perform a “cash on cash” analysis. I’ve discussed this in the past, and I regularly share this with other people for their use. The gist of this calculation is to determine whether we would get a return on the cash put into the house.
The calculation considers the cost of taxes, insurance, homeowners association fees, vacancy expectation, maintenance expectation, costs to get the place rented, property management, etc. This is compared to the projected rental income. The upfront costs are compared to the annual cash flow projection. That ratio is hopefully in the 8%-10% range to be considered a reasonable cash flow to look further into the purchase.
Since we’re not really looking to purchase properties these days, I use this spreadsheet to consider changes in a tenant’s rent when it’s time for renewal. I kept all the original cash flow amounts to see how things change over the years. As I sat down to determine what changes, if any, are needed in the rents I charge, it was disheartening to see how our portfolio has dwindled in profitability over the years.
A few years back, housing prices skyrocketed, which drastically increased our taxes owed. Unfortunately, I hadn’t increased everyone’s rent consistently. I kept many people level or did small increases every two years, but that means I’m now “behind the 8 ball” in trying to make up for those drastic increases that happened in 2021-2022. In addition to tax increases, we’ve also seen huge insurance premium increases that weren’t projected in our portfolio.
Our total “cash on cash” started at 11.42%. It’s now projected to be 7.58% – if the increases I project actually go into effect over the next few months.
We historically increased long term tenant’s rent by $50 every two years. Some of these tenants have been with us for over 5 years, and the $100-200 changes in their rent have not covered the increases we’ve seen. I hadn’t worried too much about it because the losses on those houses were offset by houses where we saw greater margins. Now, everything has leveled out, so those losses are felt harder.
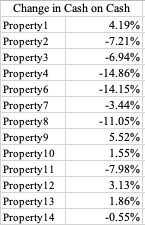
The table above shows the change from our original “cash on cash” to our current status. In some instances, we’ve been able to increase our margins. But there are 8 instances our margins decreased, with some being drastic. Even though some are drastic decreases, there are only 5 properties that fall below the 8% goal we have.
For Property2, the projection shows that rent would need to be at $2,500 for us to hit our cash flow goal. The rent is currently at $1,600. The neighborhood doesn’t call for $2,500. I also don’t want to be in a position where I’m floating someone’s rent at that price. From the time we bought the house to now, our taxes and insurance have increased by $1575. That number only continues to grow. Our insurance started at $390 and is now at $765. Our taxes started at $1,500 and are now at $2,700.
On top of the obvious ones like that, our maintenance costs have also increased. As one example, our HVAC technician first was charging $125 per site visit. He now charges $325 just to show up. I’ve found someone who charges $200, so I’ve been going with that guy, but just knowing that there’s been such a change in pricing structure needs to be factored into our costs.
These are really big affects on our houses that a tenant and the average public opinion don’t seem to grasp. I don’t get paid hourly or per transaction I perform to manage these properties, so that decrease of 3.8% in our cash-on-cash analysis is actually a net loss in my “income.” In many cases, we catch up when there’s tenant turnover, but watching the rent compared to our expenses are things that I need to be more on top of year-to-year.
