There’s a lot of chatter online these days about a “90s summer.” I’ve also been fed some reels about what “rich” looks like, and it’s not about money or flashing the perception of money. Mr. ODA and I are working very few hours these days. My job is because I’m a “helper” in life, and I know this group needs my help for a bit longer (I also tried to quit and they said no). Mr. ODA’s job is to qualify for health insurance so we save about $1500 per month in direct expenses for health insurance.
When I first started working, my goal was to climb the ladder. I wanted to be the youngest CFO in my Federal agency. Then a 34 year old woman got the job and crushed my dreams a bit, but I was still a good amount younger than her, so I just needed her to move on in the next few years. Then I went to DC. I left the house between 5:30 am and 6 am, and I got home between 4:30 and 5:30. I kept looking around thinking, “when would I see my kids if I had them?” In fact, we were denied adopting a dog because we both had full time jobs. That still fascinates me. During my fight to climb the ladder in DC, I realized that wasn’t what I wanted. I wanted to live a few miles from work where I could have more free time. I wanted to own a little piece of the pie, so to speak (my job in DC was very high level, but I loved working with the State level where I could actually see the road and bridge projects I approved in progress). But even as I made that transition, it didn’t feel right. I wanted to be home with the kid I was about to spend $30k to have. I didn’t want to put all that money into making a baby for him to sit in daycare for a whole work day and commute time (I get it – it works for people, but not for me).
FIRE. Financial independence, retire early.
While our path didn’t go as we expected as we learned more, and we both worked longer than we intended, the goal was always the same – be home with our family while they’re little. And that’s what we have. Even when I took this new job, I said my kids come first. I didn’t sacrifice in all those ways before kids, give myself freedom, and then take on a full time job. Most people struggle to understand that. Even the agents who I’m paying $600k each year can’t understand when they hear I don’t “need” to work.
So that’s my rich. I’m at the kids’ school all the time. I’m at nearly every drop off and pick up. Heck, I discharged from the hospital AMA so that I could get to a baseball game in May. I will be there. I will be cheering them on. I will lay in bed at bed time, read them books, and then ask them about their day while they tell me the most obscure things…but it’s because they just want to fill that time where they get to talk to me without a sibling interrupting.
I’m not driving a fancy car. I’m not living in a 7000 sf house just because I can. We’re not going out for drinks and sitting at restaurants multiple times per week. We’re not going to the movies every month (umm, actually, or ever, unless it’s the $2 summer flicks series). I’m making my money work for me, so that I can focus on pouring into my kids and enjoying the time of their lives that they actually want to be around me all the time.
Disclaimer: I am not personally making my money do anything. That’s all Mr. ODA. I’m just the bookkeeper, collecting rent and tracking what’s happening and trusting he has the answers on how to move the money around.
We took a trip in June to Fall Creek Falls in TN. We had looked into it a couple of years ago, but it was hard to find things to do and places to stay. This year, less people were planning to go, we have a big trip as a family planned later this year, and so we went for it. It was a nice relaxing trip.
The grandparents graciously pay for the lodging when we do family trips. We had a nice big cabin for 12 of us. We purchased food to eat at the cabin, which was really the only option because there was hardly anything for 25 miles. The first day, we went hiking and swimming in waterfalls around the park. It was supposed to rain all day, but we made it out only getting rained on towards the end of the last hike for a little bit. The next day, we hung out for the morning, went to rent some canoes ($10 for one hour), found a swimming hole, and then some of us went hiking a bit more.
I usually do trip summaries when we get back so we remember what we did and share how much we spent. In this case, we spent about $40 on gas, about $20 on meals during our travel, and about $50 on groceries. With that, it’s hard to accurately portray what we spent because it’s not the full picture since we didn’t pay for lodging. But I’m making it down that we went on a trip for 3 nights that was nice and relaxing!
We have a summer full of trips planned, and stop 1 was camping. We took the kids camping in the fall, and they didn’t stop talking about it for weeks. It was a purposefully quick trip to be able to gauge how it went. We got there in the evening, just before dark. In the morning, we packed everything up and then went for a hike. The consensus was that we needed two nights because they wanted more time to enjoy the camp site.
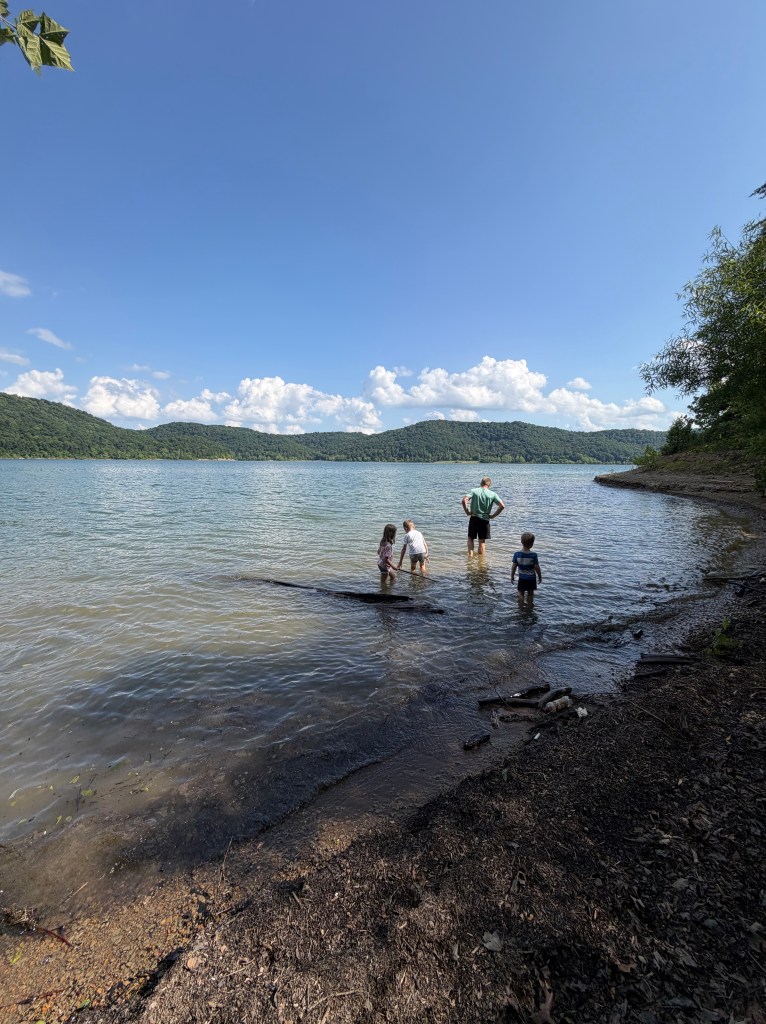
We planned a two night trip to Zilpo Campground in the Daniel Boone National Forest in Kentucky. The reservation for the campground cost us $70.62. We drove there, but that gas usage was nominal. We put a lot of time and effort into planning the meals for that duration, so that cost us about $20.
We stayed in Loop H, which is a place we had stayed before. I love how tree covered the entire loop is. Our site was H17. There was a path down to the water, and the kids enjoyed swimming there. There’s a beach area at the campground, where we spent a few hours. We did a hike off Deer Loop. And we roasted lots of marshmallows!
We planned the trip a few weeks ago, so we obviously didn’t know how the weather would turn out. It rained for a bit on the last morning, but hardly any of our things got wet thanks to the tree cover. The unfortunate part was that a humid wave came into town just for the time that we were camping. The week before or after, and we would have had a nice high 70s day with low 60s nights. Instead, we had highs in the 90s and lows barely breaking below 80.
A simple post for a simple trip. 🙂 Not to mention, we got away from home for 2 nights and spent less than $100!
Mr. ODA’s retirement account surpassed $1 million last month!
Mr. ODA and I worked for the federal government. Our retirement account is called the Thrift Savings Plan, but it’s essentially a 401k, and includes a 5% salary match on contributions. My parents were adamant that I put at least the amount in to get the full match, and to increase my contributions as I received raises. Mr. ODA entered into my life and said I was to max it out no matter what, and so I did. The point here being he’s maxed it out from the beginning. I worked for about 11.5 years, and he worked for about 16 years. My last contribution was May 2019, and his last contribution was October 2025.
I share this background to make the point about compound growth. The max I could have contributed over my working time was about $190k. The max Mr. ODA could contribute was about $305,000. So that means that based on $305,000 of his own money, he now has a valuation of over $1 million.
We bought this house in September 2019. Based on the comps in the neighborhood and time of year, I thought listing it for rent over $1000 wouldn’t yield quick results. I had the property manager list it at $975, which would have been easy to get in a Spring market. When it was still sitting 3 weeks later, we dropped it to $875. It took another 2 weeks to get it rented. Honestly, I blame the property manager. I have yet to find a company-driven property manager rent a unit of mine in less than 6 weeks, where I’ve had mine rented myself in a matter of one-two weeks (with a recent exception tha took 3 weeks). There were some concessions we gave to make it happen (no payment until November 1st), and the tenant would pay half of rent the month before it was due and the other half on the first. There were numerous errors made on executing the lease by the property manager, and I don’t believe the tenant was vetted correctly, so I eventually took over management.
There were a couple of rent increases along the way, to where she was paying $975 per month as the lease expired. She lived there for a couple of months shy of 6 years. Going into the final walk through, we were leaning towards selling the house. But we had people hunt us down (either on the street, finding my phone number, or through Facebook) to tell us they wanted to rent it. It was crazy. This outdated house with street parking and only one bathroom. Your neighbor has a whole kitchen in his front yard. It was really hard to understand.
MAINTENANCE HISTORY
In 6 years, we spent less than $5k on maintenance on the house. She was really slow to report issues. We did a few plumbing fixes over the years, replaced the back deck that was basically in shambles, and replaced the roof through an insurance claim. The insurance claim also yielded us being dropped by that company because there was a trampoline in the backyard. I had to threaten the tenant with that removal for about a month, but it eventually was taken away.
When Mr. ODA would go there, he would note things that looked like a temper caused damage (the handle on the screen door was snapped), but it’s hard to point that finger. There were red flags all over the place, but I didn’t know the extent of the issues until a neighbor got our attention on a drive by check. I knew they weren’t the best tenants and that there were surely issues they weren’t reporting, but it’s hard to get a true gauge when you don’t see the day-to-day activities. Apparently the cops had been called multiple times for fights in the street and there were rumors that she was having her fun with the married neighbor.
She had people living there who weren’t on the lease, so that really yielded no reporting of issues. The neighbors claimed that she had moved to Ohio in May of 2024 and had her adult kid and her friends living there. When we weren’t the one to vet her or know her for the first several years, it’s so hard to then develop that relationship with a tenant. Rent was always paid on time, and we were there to at least see it was still standing a couple of times per year.
THE TURNOVER
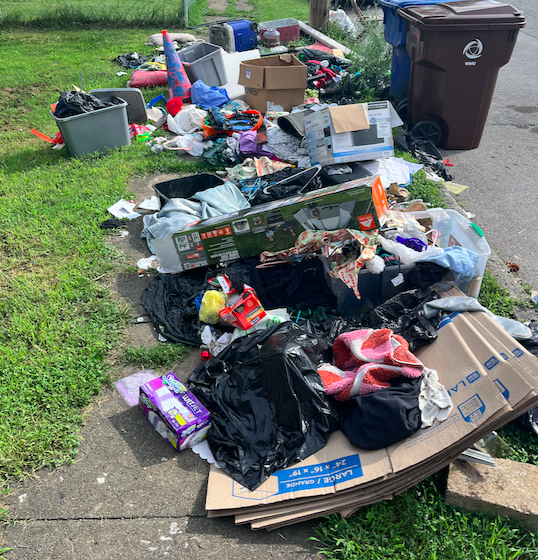
She said they’d be out on July 22nd. We drove by on the 21st and saw that their vacancy was to just throw all their trash on the front yard. It ended up taking me 2 hours to sort through, get into bags, and either get it to the side of the house for a future available trash can or into a trash can at the curb (which was ironically empty and very clean). A neighbor was listing their house later that week, and their Realtor found out my phone number, and she called me to ask if I’d have it cleaned up for their listing pictures (she assured the owner that our house wouldn’t be in any pictures).
Surprisingly, we only spent about $1700 on repairs (outside of the fridge). It took a lot of our time though.
We showed up to work one day and I was hearing a weird sound in the back bedroom. It turned out that the water heater supply line was busted and there were several inches of water in the crawl space. The city actually called us to let us know (once we turned it off) that it had been running since midnight. They had Mr. ODA bring in the receipt to show it was fixed and knocked the $500 bill in half, so that was pretty sweet.
We had to replace the refrigerator because that was disgusting. The gasket around the door was sliced like someone just needed something for their utility knife to do. A tray and drawer were missing. That was $530.
There were random jobs that needed to be done, like replacing the sink sprayer, replacing broken light fixtures, replacing shower tiles that they had put mosaic tile in with caulk (why?), installed tracks for the bifold closet doors (where did they go?), fixing a stair tread that was broken.
One of our bigger concerns was the smell of urine. We spent weeks trying to get the house to not smell. It was bad in the bathroom, so Mr. ODA replaced the wax ring on the toilet. It was bad under the stairs (we think they kept a dog kenneled there), so we spent weeks laying baking soda, sucking it up, laying more, etc. We hung Arm and Hammer air cleaners. By the end, it didn’t hit you like a ton of bricks when you walked in the door, but I’m not sure we were 100% successful if you went looking for the scent.
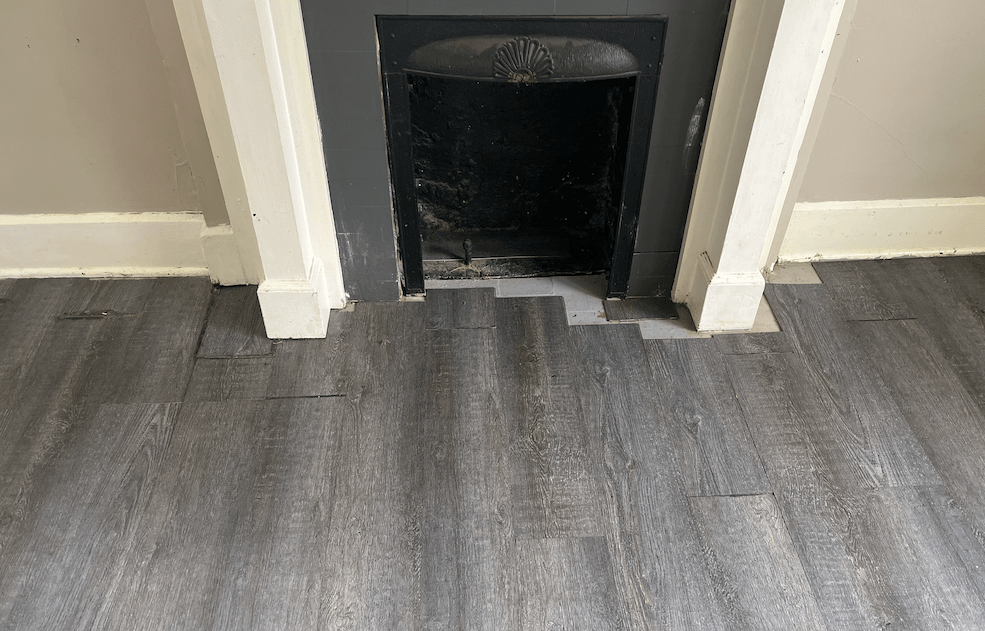
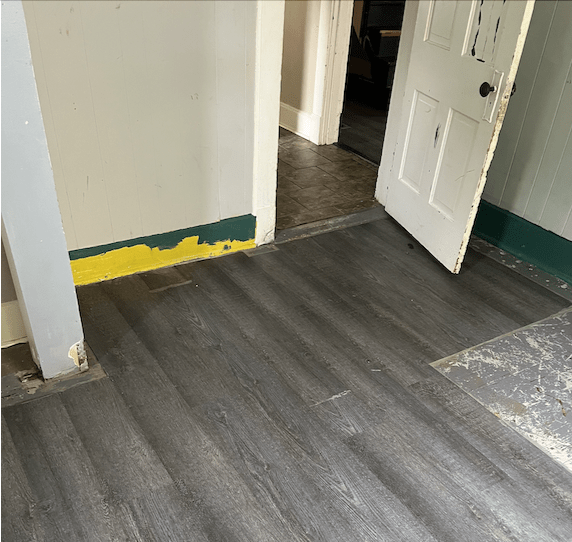
FLOORING The house has painted floors. The tenant must have been annoyed by the paint being scratched up because of her dogs, so she laid luxury vinyl plank. It was one of the worst jobs I’ve seen. She was really proud of it and was concerned about getting her security deposit back, so she kept pointing out that she laid the floor on her own dime. I kept pointing out she didn’t have approval to do that. It’s one thing to lay the floor that would just be labor to get it up, but instead of moving furniture to lay it, they just used their black caulk to cover the edge. Well, in many places except here, where this was apparently a worthy job.
And the floors are basically the subfloor also, but we couldn’t lay flooring over it because then the doors wouldn’t work, but we couldn’t shave down the exterior door because then it would be drafty. We decided to go with deck paint on the floors. They looked great, but they’re not going to hold up. We also painted all the walls and a few of the ceilings. The house was so dirty and not taken care of. The walls had a lot of tape and holes in them, so there was a lot of patching that needed to be done before painting even took place.
PAINTING Someone painted the bathroom black, so I used some of my left over navy to repaint that room. I had to paint the ceiling in there because of water splatter marks and their inability to actually paint a room correctly, so the black wall paint was all over the ceiling. Someone also painted 85% of the trim in the living room black, so that was quite a few coats of white trim paint.
One of the bedrooms was painted wood paneling, so that took a lot of effort to get painted. All of the doors needed to be painted and nearly all the trim had to be painted because of their abnormal wear and tear.
DOORS The biggest expense was the back door. Over the years, people had shimmed the door jamb and hinges. There was no coming back from that. We hired someone to replace the whole door. It turned out the door wasn’t a standard size, being about a foot shorter than normal, so it was a whole fiasco. That cost us over $1000.
We also had to replace the bathroom door because it was destroyed. We patched up the other doors that were also broken because of that temper I mentioned earlier.
EXTERIOR When the original tenant lived there, she cared a lot about the outside. She put effort into a garden and even made a koi pond (absolutely against the lease). But a garden left unattended becomes an eyesore. We had to pull weeds and bushes, and it made a big difference to how the house looked. We also had to spray down the porch and paint that. That’s not something we really wanted to spend time or money on, but it’s the first thing you see when you walk in, so it had to be done.
THE LISTING
The house was vacant for a total of 67 days, but that was mostly because of the work we had to do to it. We listed it on the 20th, showed it to several people, and had the listing removed on the 23rd. We got it rented at $1,150. Mr. ODA wanted to go higher, but I was worried about the time of year and all the loss we had already taken on it. We probably could have gone higher. At least so far the tenant has been great.
The living room was my favorite transformation. This picture doesn’t truly capture the time that went into this room, but the end result is adorable. That wood feature wall was another thing the original tenant did without approval, but it’s not in terrible shape at least.
I like to do recaps of trips we take, highlighting our spending decisions. For spring break, we had planned on doing a big trip out west. Ultimately, we decided the kids were still too little to push such an itinerary. Along that timeframe, I also started a new job, where taking a week off just didn’t feel right, and then Mr. ODA had the weight of “what’s happening in the government” on us too. So we decided to do a long weekend to Columbus and Cincinnati Ohio, which aren’t extravagant, but met our needs with little kids.
We went to CoSI in Columbus, which was a perfect day. We explored that city one day, went hiking on another, and then went to a Reds game.
ENTERTAINMENT: ~$200
We went into this trip for a specific entertainment purpose, so we knew we’d spend money on those things. We bought 4 tickets for the 5 of us to get into the CoSI museum. It was well worth it. We were there before opening and closed the place down. The kids had a great day.
On day 2, we explored Columbus. It was a little chilly, so it wasn’t great being outside. We went to a nature center and walked around inside, doing their little coloring activities. Then we did an obstacle course that was meant for adults, but the kids gave it their all. Outside of lunch at McDonalds and ice cream at dinner, we didn’t spend anything this day. We were able to get back to the condo for the littlest to take a nap, so the day worked out really well.
On day 3, we packed up from our condo and went hiking at a state park. It was a really nice day and the kids did so well keeping up and walking the whole way (well, the 2 year old was in a pack). We checked into the hotel and then went to dinner at a sit-down restaurant, which killed some time.
On the final day, we ate breakfast and the kids went swimming at the hotel. Then we packed up, drove into KY to find free parking, walked across the Ohio River to the Reds stadium, and spent the afternoon at the baseball game. The Reds have a kids play area, which was right at our seats. Surprisingly that didn’t pose an issue with the kids; we went to our seats and watched the whole game. It definitely helped that it was barely more than 2 hours of game time! Then we all walked back over the bridge (this was impressive to me with 2 kids walking) and got home before bed time.
LODGING: ~$900
We like to pick an AirBnB type place for our trips. Our youngest still required a pitch black room for sleeping. We also just want to be able to put the kids to bed, but stay up ourselves. We booked a condo (which I try to avoid so I don’t have the stress of keeping kids quiet for neighbors), but it was awesome. There was a pool table in the lobby, it was easy to navigate, and we didn’t have any sound issues. It was walking distance to CoSI and we had a surprise art fair right outside one night. I just wish it had been a bit warmer so we could have used the pool they had open, but I really enjoyed.
We had paid $246 for a hotel night in Cincinnati. We booked it through our Chase travel portal, which becomes relevant later in this story. The itinerary of our trip meant that we wanted to leave Columbus, go hiking for a day halfway to Cincinnati, and then spend the night near the baseball stadium. We figured a hotel would be easiest because we’d get a pool to play in and breakfast handled for us. We checked in, got our things from our car, and THEN the front desk told us “oops – you booked two beds, but we only have a king.” We ended up making it work, but that was frustrating. Then the next day, they had told us they’d take $100 off, but our bill showed about $60 off. We tried to fight it, but they kept claiming they couldn’t do anymore because it was a third-party booking (and yet you could do something?).
FOOD: ~$150
We didn’t go into it pushing that we’d eat at the AirBnB, so that was a nice break from stress. We usually make sure to maximize our food budget by eating meals at our house, but it helped our itinerary this time around to eat at restaurants. We brought breakfast foods since we’re not extravagant breakfast people.
We stopped at Costco on the way up there, which gets us gas and a quick/cheap meal. We ate lunch at the museum on day 2 and made dinner after a long day at the AirBnB. On the third day, we ate lunch at McDonalds (which we’re well-versed in using the app for deals) and made dinner again after getting ice cream out. Then we packed lunch for a hiking day and ate at a restaurant that Mr. ODA was reimbursed for (doing ‘shops). For the final day, we ate breakfast at the hotel and then ate at the Reds stadium the last day. Mr. ODA bought one of the ‘all you can eat’ packages, which worked out well for us.
SUMMARY
I definitely recommend CoSI. Our kids were 6, 4, and 2. All 3 of them had fun, and we had no issue staying the whole day. I don’t think it’s necessary to do a second day. We did two planetarium shows and were able to hit all the sections except the indoor toddler play area (which I didn’t find necessary since we can do that outside a museum). The kids did great at the museum, walking around Columbus, hiking, and going to the baseball game. It was just the right pace that kept us occupied, but not overly busy and stressed.
I’ve been busy getting started with a new job that should officially begin in the next couple of weeks. I’ve still subbed at the preschool a few days over the last month. I’ve been working on financial consulting work for a school in Virginia. I’ve also been trying to get our homeowners association documents in order while I execute a transition I initiated for a new management company, as well as getting the budget in order well before it’s presented to homeowners months after the start of our fiscal year. Anyway, laying all that out makes me realize I’ve juggled a bunch and have been pretty happy about all that activity going on.
In addition to what I’ve been juggling, Mr. ODA is a federal employee. So the current climate has been hanging over our heads. The uncertainty of what the future holds is more concerning than it has been in the past. Luckily, we’ve set ourselves up for success, but it still is hard to manage that we may not be in control of that decision.
RENTALS
We had multiple houses pay rent late this month, and I’m still working with another house that has been late for the last 3 months and isn’t fully caught up yet. We had one house break the screen door (claiming the wind grabbed it and slammed it against the railing), so we replaced that for $400 with labor. Another house had a faucet leaking and a door knob that wouldn’t twist. I also have to get out to a house here in KY that had lattice under the deck fall down. It’s supposed to rain all weekend, so I think I’ll head out there tomorrow and handle that before the rain this weekend.
NET WORTH
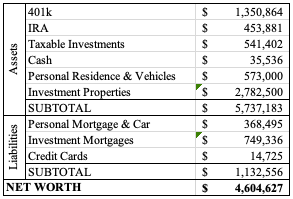
We recovered from last month’s slump, but we’re still slightly below December’s number. Other than the last two months, we’re still greater than any other net worth calculation we’ve had. Our investment accounts raised slightly, and our debt amounts decreased slightly. Both sections trending in a good direction. There were no major purchases or adjustments to our accounts this past month, and mostly our spending was fairly low.
Social security was signed into law by President Roosevelt in 1935. One of the intents of the program was to provide income for retired workers aged 65 or older. The purpose of the Social Security Act was to help destitute aging individuals who were not receiving regular income. The program calculations have changed a bit over the years, but the purpose has remained the same: provide a minimum income to aging individuals, not to provide a source meant as your sole income stream.
Today, most of the United States workers pay into social security through a 6.2% payroll withholding; such withholding ceases once you make $160,200 or more (in 2024). An individual’s year of eligibility is based on their birth year, rather than being exactly 65 years old like it was originally, and is called the normal retirement age. Additionally, there are penalties for filing early and bonuses for filing later than your normal retirement age. The year you file for social security has implications on your income, which I’ll cover later.
CALCULATING SOCIAL SECURITY RETIREMENT INCOME
Social security benefits are computed based on an individual’s highest 35 years of indexed income. The income is indexed, or adjusted, to account for inflation over the years. If you made $10,000 in 1985, that equates to making about $25,000 in 2022. I mention that it’s in year 2022 and not today because indexing applies to all income older than the last two years, while the most recent years are taken at face value. Indexing ensures that your future benefits account for inflation to make them fair and equitable in the year you need that income, and makes all of the annual salaries of your working years comparable.
Once the indexed total is known for all working years (up to the highest 35 years worth), the totals are added together and divided by the total number of months worth of earnings. The average monthly earnings amount is then used to calculate the primary insurance amounts (PIA). The PIA is the amount paid out monthly if an individual waits until their normal retirement age, which is a table published by the Social Security Administration (SSA) and is based on birth year.
According to the SSA website, an individual who first becomes eligible for old-age insurance benefits or disability insurance benefits in 2024, or who dies in 2024 before becoming eligible for benefits, his/her PIA will be the sum of: (a) 90 percent of the first $1,174 of his/her average indexed monthly earnings, (b) 32 percent of his/her average indexed monthly earnings over $1,174 and through $7,078, and (c) 15 percent of his/her average indexed monthly earnings over $7,078. The percentages are based in law, but the dollar amounts, which are called ‘bend points,’ are updated annually based on the national average wage index. These bend points ensure the program weights benefits to lower income earners, and phases out benefits as an individual’s income increases.
Here’s an example that shows how the bend points are used to calculate the PIA, which is the monthly benefit amount that would be paid out to someone who retires at their normal retirement age and is eligible to receive 100% of their PIA. The monthly indexed earnings over the life of their 35 year career was $10,000. The bend points are applied to each bracket of income up to their max of $10,000, and then the bend points are added together. The total is rounded to the nearest dime though.
If you draw before the normal retirement age, but no earlier than 62, the PIA is reduced by as much as 30%. If you draw after your normal retirement age, the PIA is increased by 8% per year, until you reach 70. In the above example, the earner who made $10,000 a month average over the course of their career will receive ~$3,383 a month if they file for social security benefits at their normal retirement age (in 2024 numbers). If they chose to draw at 62, they’d receive 30% less of their PIA, equating to approximately $2,368 per month. However, if they chose to draw later than their normal retirement age, they would receive more than their PIA (with the amount depending on their normal retirement year).
As you can see, social security is not intended to replace your pre-retirement income. It is meant as a safety net to ensure some level of financial security. If you’d like to live a more lavish retirement, you need to plan ahead with additional sources of income/savings to draw from (e.g., retirement plans like a 401k, Individual Retirement Account (IRA) contributions).
WHEN TO DRAW
We recently heard a conversation where someone told another person that they should definitely claim as soon as possible. However, if you’re not in a situation where you absolutely need that income per month, it’s best to wait. Once you draw, you lock in that dollar amount, save for cost of living adjustments as authorized. Cost of living adjustments for inflation, or COLAs, are based on the Consumer Price Index and announced annually in October.
The year you draw is based on your outlook on your life expectancy, your income need based on lifestyle, and your other income sources. This isn’t a decision you need to make at 35, but you should be watching and planning this over the course of your life. If you’re in good health and active at 62, and have saved enough to live off other funds or are still working, it likely wouldn’t be in your best interest to claim social security benefits.
If you’re born in 1960 or later, your normal retirement age is 67. At 67, you get 100% of your PIA. If you file at 62, which is the earliest you can file, you get 70% of your PIA. If you wait to file until after your normal retirement age, then you get 8% each year until 70. On the graph above, I used a PIA of $3,500 to determine the values for the example. You can see that if you were to file at 62, your cumulative income line over the rest of your life time is a flatter line. You’re receiving a smaller benefit, so it’s adding up slowly. Where the lines intersect is how you’ll determine your break-even draw year. For instance, if you think you’ll live until at least 77, then it’s not worth doing an early draw at 62 because a draw at normal retirement age will provide you more income over the course of your life. If you think you’ll live past 81, then deferring your social security filing until 70 yields the most lucrative scenario.
RETIREMENT AND WORKING
There are stipulations associated with claiming benefits and still working, which is another factor to consider when drawing social security. If you’re 62 and still working, then it may not be in your best interest to collect social security. While you can still work while claiming social security, the SSA may reduce your benefits. The SSA reviews income earned against benefits paid out, and may adjust if there was employment income in the previous year (i.e., income based on pensions or other retirement benefits does not constitute current employment income).
If you are under normal retirement age for the entire year, the SSA deducts $1 from your benefit payments for every $2 you earn above the annual limit, which is $22,320 in 2024. In the year you reach normal retirement age, the SSA deducts $1 in benefits for every $3 you earn above a different limit, which is $59,520 in 2024. It’s likely you don’t “need” that money because you’re still working, your benefit isn’t increasing like it would if you deferred, and you’re actually receiving less money in benefits than based on the normal formula.
SUMMARY
There is no hard and fast rule on when to draw these benefits. The point is to be educated on your options. We don’t recommend you rely on someone else’s opinion on the matter or how it worked for them, as each person’s variables are different. Generally, if you’re in good health and still producing income, drawing on the social security benefits earlier than normal retirement age isn’t going to be your best financial move.
As is the case with most personal finance topics, having diversified income sources in retirement, regardless of what age that is, will set you up to make decisions absent emotion and desperation, and for the betterment of your entire financial picture. Utilize your 401k and all available match, your IRA, your taxable savings, and perhaps your pension, so that Social Security is just one more tool in your financial picture, rather than the only one.
Series I savings bonds are a type of bond offered by the US Government, with the intention of hedging against inflation. They provide the purchaser a return that is commensurate with the rate of inflation during the life of the loan. The caveat – this rate adjusts every six months. Between the months of May 2022 and October 2022, these bonds will pay an annualized interest rate of 9.62%. Guaranteed. Depending on what inflation does by October, that rate may go up or down, but as long as you purchase the loan before Halloween, you can enjoy that rate for the first 6 months of ownership. This is because the rate only changes every 6 months and the interest accrued compounds semi-annually.
Some Rules
I bonds must be held for 1 year. Therefore, you need to be sure that money can be made illiquid for that amount of time. Think of it like a Certification of Deposit, or CD, you can buy from a bank; however, in today’s numbers, an I bond has a FAR higher rate of return. If you need to liquidate the I bond before 5 years, you must forfeit the final 3 months of interest from when you sell/cash it (e.g., if you hold it for 18 months, you earn interest for only 15 months). After 5 years, there is no penalty. The bond will earn interest at the prevailing semi-annual rate for 30 years if you don’t cash it out, and after that it wont earn anything. The rate will never go below zero, even if the inflation rate (Consumer Price Index for all Urban Consumers) does go negative, although is can be 0%.
There’s a minimum purchase amount, which is $25 for electronic purchasing and $50 for paper purchasing. Then there’s a $10,000 individual, annual (calendar year) limit for owning bonds each year for each individual, which covers receiving or giving them as gifts as well. Example, I can buy $20,000 in a year if I’m giving a relative $10,000 of them, but that relative then cannot buy any because they now own that $10,000 I gave them. There is not a limit per household, so spouses can double up.
I bond earnings are subject to federal income tax, but not state.
Calculate the Rate
The I bonds have a fixed rate and a variable inflation interest rate.
The fixed rate is stays the same through the life of the bond. The fixed rate is set each May1st and November 1st, and it applies to all bonds issued in the six months following the date the rate is set. The current rate is 0%.
The variable interest rate is based on the inflation rate. It is calculated twice a year and is based on the Consumer Price Index.
These two rates are then put into a formula to get the “composite rate.” Composite rate = [fixed rate + (2 x semiannual inflation rate) + (fixed rate x semiannual inflation rate)]. This means that currently, it’s [0.0000 + (2 x 0.0481) + (0.0000 x 0.0481)], which equals 9.62%.
Interest is compounded semi-annually.
How to Purchase
Series I bonds are bought through TreasuryDirect.gov after creating an account. This helps ensure legitimacy and provides simplicity for the purchase and ownership of the bonds.
You pay the face value of the bond. For example, you pay $50 for a $50 bond, and then the bond increases in value as it earns interest. For electronic purchases, you can buy any denomination, to the penny, between $25 and $10,000.
You can buy paper Series I bonds if you don’t want to set up an online account or make online purchases. When you file your tax return, include IRS Form 8888. Complete Part 2 to tell the IRS you want to use part (or all) of your refund to purchase paper I bonds. Purchase amounts must be in $50 multiples and you can choose to have any remaining funds delivered to you either by direct deposit or by check. There’s a limit of $5,000 worth of paper bonds. More information can be found on the Treasury Direct website.
I Bonds for Me
A guaranteed return of 9.62% for the first 6 months of ownership is quite enticing. High Yield Savings Accounts and bank-issued CDs are still hovering in the 1-2% interest range, and the most recent year over year inflation report announced for April 2022 was at 8.3%. Given COVID-19 numbers trending upward again, American and global supply chains still struggling, and the effects of trillions of dollars of extra money entering the American economy as bailout for the American public taking a long time to stabilize, I figured the consumer price index numbers that I bond rates are based off wouldn’t be dropping quickly anytime soon.
My logic. Again, a guaranteed return near 10% is phenomenal, even if possibly short term and variable. “Best” case scenario – the rate stays high and the interest keeps compounding for many semi-annual cycles. Granted, this also means that the inflation rate stays high and that isn’t something I’d prefer for my total financial outlook. But Series I bonds are hedges for the effects of inflation. So at least I’m “keeping up” in this section of my portfolio.
The most likely/medium case scenario – control over inflation happens in the next year or two and the rate drops several percentage points, such that it’s a real decision whether to keep a guaranteed return of 4-5% or to cash out the bonds and put that money into other investments. This would also mean that I’d lose 3 months’ worth of that 4-5% interest if this decision happens sooner than the 5 years.
“Worst” case scenario – for THESE bonds at least. Inflation stops and the interest rate on these bonds plummet. I cash out the bond in a year or two and I lose 3 months of interest. But let’s face it, the reason I’m quick to cash out is because the interest rate is low anyway. So I’m not losing much! And then, that also means that the rest of the American economy and my portfolio have been stabilized and things look a little more predictable.
When forecasting any of these three scenarios, I saw a fairly win-win-win situation, so I pulled the trigger on a major purchase of these bonds with some of the discretionary cash Mrs. ODA and I were sitting on as we navigate the craziness in our life right now.
The common goal in the FI/RE (Financial Independence, Retire Early) community is to reach a point where your net worth is 25x your annual spending, meaning your expenses are 4% of your net worth. This is an extreme oversimplification of things because of the number of variables associated with where your net worth might be, and how to access it. For example, retirement accounts have requirements to be met before drawing funds; while you may have hit the 4% expense to net worth ratio, it may not mean that you have that money liquid to cover your spending.
When the ODAs started down the path of FI/RE, we did it with a real estate rental portfolio. This path of net worth growth really doesn’t fit the traditional mold. It provides regular cash flow, rather than an account with a balance that’s drawn down.
As mentioned in previous posts, there are numerous ways to make money in real estate. The path we have taken is probably one of the simplest and most repeatable for anyone. We own a portfolio of single family rental houses, most of which were bought straight from the MLS. These basic properties are in basic neighborhoods with regular tenants. Nothing special. We acquired these properties by focusing on the 1% rule in real estate – try to secure 1% of the property’s purchase price in monthly rent. Another oversimplification of how things really go, but if we were able to find a $100k property that rents for $1,000 a month, we know we’re going to make money long term.
For these properties, we typically put 20%-25% down and finance the rest through a conventional mortgage. We find a tenant, and then the 4 ways to make money in real estate go to work for us: appreciation, tenant mortgage pay-down, tax advantages, and most importantly for our situation and FI/RE – cash flow.
I want to talk about how we can reach a FI/RE number through real estate cash flow differently and more quickly than using traditional stock market investing.
The $100k house had a 20% down payment and mortgage rate at 5% interest, which brings the monthly principal and interest payment to $429. Add another $121 for taxes and insurance (using round numbers here!), $100 for maintenance and capital expenditures savings, and $100 for a property manager; this comes to $750 worth of monthly expenses. At $1,000 per month of income, you have $250 per month of cash flow in your pocket. $250 per month equates to $3,000 per year of cash flow. With the $20,000 down payment and about $5K in closing costs, it means that our $25k investment nets us $3k per year in cash flow.
Circling back to the 4% rule for stock market investments, $3k in cash flow requires a savings of $75k. But we only had to invest $25k! We’re banking on the monthly cash flow, rather than a “stagnant” savings.
We took that math and ran with it. Our rental portfolio has 12 houses in it. While we’ve shown in prior posts that each house’s numbers aren’t as clean and simple as this example (some better, some worse), if we take that $3k annually and multiply by the 12 properties, we have $36k in annual cashflow for only $300k invested.
What would you rather need to produce $36k income – $300k or $900k?
Can you scale a rental portfolio to reach enough annual cashflow such that you can live off the cash flow?
Rental property investing is not completely passive. We have tenants to manage, properties to maintain, property managers to manage, income and expenses to track for taxes, lending efficiencies to explore, and the list goes on. But if you’re willing to put in a little work to reach financial independence (the FI part), you can do it substantially faster by finding strong properties to provide significant cash flow than if you were to take the totally passive route of simple stock market (index fund) investing.
Note, there’s nothing wrong with that – we have a substantial position in the stock market due to the tax free growth benefits of retirement accounts. The power of real estate investing saw our net worth grow faster than we’d have ever dreamed since we bought our first rental in 2016. The proof is in the pudding and we advocate to anyone to just get started!